

Datapanels
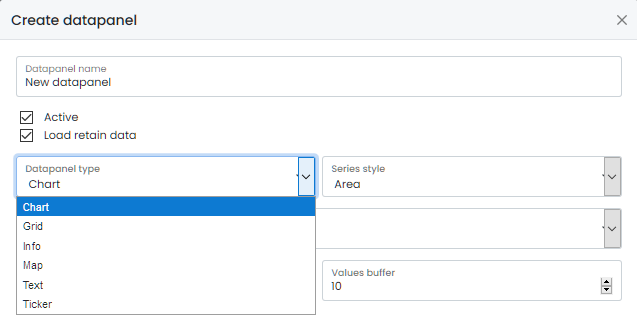
Datapanels display Thing data in different visual formats. The available types are:
- Chart
- Grid
- Info
- Map
- Floor map
- Text
- Ticker
- Video
Common configuration options
These options apply to all panel types:
- Active: enables the datapanel.
- Load retain data: loads historical values when the panel supports them and the Thing retains data.
Chart
The chart panel supports these visualisations:
- Bar
- Line
- Area
- Point
- Circular gauge
- Numeric gauge
Grid
Select the attributes that you wish to include in the grid. In the datapanel editor, drag the handle on a selected attribute to set its column order; keyboard users can focus the handle and use Space or Enter followed by the arrow keys. The saved order is retained when the datapanel is reopened. The Time column is always shown first, and array attributes keep their generated subcolumns together.
Info
Use the info panel to display visual markers for selected attributes.
Map
The map panel accepts data input with co-ordinate information. See the JSON data format reference for details of how to encode location data.
Where to configure it
Open a dashboard, create or edit a datapanel, and select Map as its type. The map datapanel editor has two configuration sections:
- Map configuration controls tracking, zoom, the initial view and map interaction.
- Map layers controls the points, satellite imagery, cadastral parcels and SIGPAC parcels shown on the map.
The map preview is collapsed when the editor opens. Use Show map preview to display it while configuring the panel. The preview is only an aid for configuration; the saved layer order and map settings are applied to the datapanel when it is saved.
Map configuration
- Track mode controls how the map follows incoming locations:
- Always recentres the map on the current locations.
- Outside recentres it when a location falls outside the current viewport.
- Never uses the configured position instead of deriving the starting position from the locations.
- Zoom sets the initial zoom level. Higher values show a smaller area in greater detail.
- Position is available with Never and uses decimal degrees: latitude from
-90to90and longitude from-180to180. For example, Madrid is approximately40.4168,-3.7038. - Interactive map controls whether viewers can drag or zoom the map. Turn it off to keep the map static while still allowing layer selection.
- Initial view stores an optional bounding box for the map. With the map positioned as required, use Save current view as default in the map header. This is useful when a georeferenced Sentinel image should fill the panel. Use Clear in the editor to remove the saved view.
Map layers
Use Add layer to add a layer. Layers are drawn in their saved order; drag a layer by its handle to reorder it. Use the collapse control on each layer to hide its editing fields without removing the layer.
Points layer
A points layer displays device locations or coordinates stored in Thing attributes. Select the Things in the datapanel data source first so they are available in the point editor.
- Give the point a name and select a device.
- With Device as the location source, the point uses the device latitude and longitude.
- With Attribute as the location source, select one latitude attribute and one longitude attribute. Both values must be decimal coordinates.
- Pointer colour is optional. Track colour is available for attribute-based locations.
Sentinel image layer
A Sentinel layer can use a generated satellite image or an existing georeferenced HTTPS image, depending on the layer configuration.
For a generated Sentinel image, configure the product (True color, False color, NDVI or NDWI), time selection, maximum cloud coverage, and the bounding box. Choose Most recent to use the newest matching Sentinel-2 acquisition from the last 30 days, or choose Set dates to reveal a date range in which Visamic selects the least-cloudy matching tile. The bounding box uses decimal-degree North, South, East and West values. Provide either Width and Height in pixels, or a Resolution in metres per pixel. The end date must be after the start date when a date range is used. New generated layers use most-recent mode and a 20% maximum cloud estimate by default, which is a practical starting point for agricultural monitoring. Visamic shows the selected acquisition date and tile cloud estimate in the map legend. The cloud value is a provider estimate for the full tile, so it may differ from cloudiness in the requested area. Visamic does not relax the cloud limit or search outside the applicable period; if no image matches, the map reports it and suggests widening the range or cloud limit.
When the organization reaches its monthly Sentinel limit, the map continues to receive the organization's last successfully generated image until the usage period resets. If there is no successful image in the current period, the quota error is shown.
You can also enter a Spanish rural Cadastral reference and select Locate parcel. Visamic resolves the parcel through the Cadastre and SIGPAC services, fills the bounding box automatically, and saves the reference as optional layer metadata. Editing the bounds manually clears that reference. For a generated image, the resulting bounding box is sent to Sentinel; for a static image, it only positions the existing image and does not generate new imagery.
For a static image, provide an HTTPS image URL and its decimal-degree bounding box. Opacity and Attribution are available for both variants.
SIGPAC parcel layer
SIGPAC layers are specific to Spain and require six parcel codes, with an optional recinto (re). See the dedicated SIGPAC layer configuration guide for the fields, example values and official service links.
When the map panel opens it uses the saved initial view when one is configured; otherwise it centres on the configured starting position or the available layer content. From then on it repositions itself according to the selected track mode when the map is interactive. The Leaflet layer control lets viewers toggle configured layers without changing the saved datapanel configuration. Existing maps using the legacy points setting are migrated automatically.
SIGPAC geometry is loaded from the public service when the six codes or re change. Visamic renders the returned geometry and fits the map view to its bounds. Moving or zooming the map does not trigger another SIGPAC request. The parcel bounds control the map viewport; the dashboard grid cell size remains an explicit layout choice.
Parcel GPS layer
Parcel GPS displays a cadastral parcel from its cadastral reference. Select the country coverage, enter the reference and set the opacity. It supports the country codes currently available from Parcel GPS, including Spain, Portugal, France, Italy, Germany and Austria, as well as the separate Basque Country and Navarre cadastres.
The Parcel GPS API key is configured by the Visamic backend and is never stored in the datapanel or sent to the browser. The layer is loaded when the map is displayed, and its popup shows the province, municipality, polygon and parcel values returned by the service when available. Each organization has a limit of 5 uncached Parcel GPS lookups per month. See the Parcel GPS layer configuration guide for the supported reference formats and API documentation.
When the organization reaches that limit, the map continues to receive its last successful Parcel GPS lookup until the usage period resets. If there is no successful lookup in the current period, the quota error is shown.
Floor map
Use a floor map to show selected machines at fixed positions on an uploaded floor plan. Create or edit a datapanel and select Floor map as its type. Select the Things in Edit datapanel, then click the datapanel title or choose Edit floor map from its menu to open the dedicated floor map editor.
- Upload a PNG, JPG, SVG or WebP floor plan.
- Select the Things that represent the machines you want to show.
- Add custom pointers for areas, equipment or other landmarks that are not Things, and give each one a label.
- Drag each machine pointer on the plan, or set its horizontal and vertical position from
0to100percent. - Choose a pointer colour when you need to distinguish machines visually.
- Choose a small, medium or large pointer size, or select a custom percentage between
25and200.
The floor map editor and datapanel view include zoom controls for detailed plans. When zoomed in, drag an empty area of the canvas to move around the plan. Custom pointers are independent of the Things selected for the datapanel.
The saved positions are normalized to the panel, so they remain correct when the dashboard is resized. The viewer shows each Thing name or custom pointer label, and displays a connection-status indicator for online Things. Updating the selected Things automatically adds or removes their pointers; custom pointers are kept independently.
Text
Select the attributes to include in the text panel. No further configuration is required.
Ticker
Marks two colours, one for a value that has changed positively since the last update and another colour for a value that has changed negatively. When there is no change in value no colour is applied to the value square.