

Data & actions
After connecting a sensor and creating a dashboard, you can process incoming values and react when they meet a condition.
Visamic provides two tools:
- Functions transform or summarise values, for example by calculating an average.
- Triggers detect a condition and run one or more actions.
Functions
The function editor currently includes these types:
- Average
- Moving average
- Root mean square
- Standard deviation
- Trend
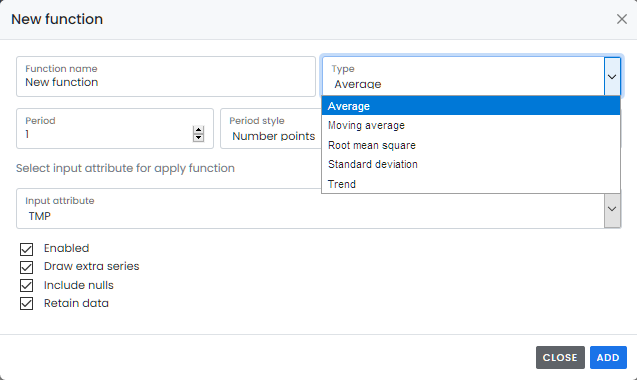
To set a function to calculate over a partial data group, set the period to the number of points you require. Each calculation consumes one consecutive group of that size: with a period of 10, the first result uses points 1-10, the next uses points 11-20, and incomplete groups wait for more data. Points used by an earlier calculation are not reused.
A function can be selected independently of its source attribute and can be displayed in a datapanel on its own.
Triggers
Use the Triggers area in the main navigation to add or modify triggers.
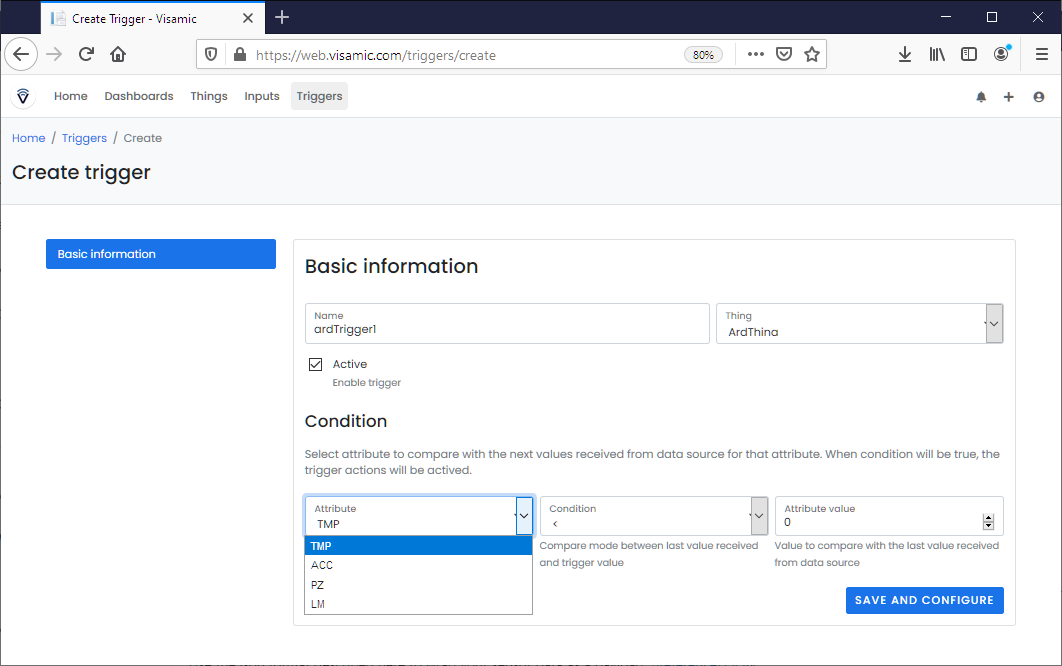
Select the attribute to monitor and define the condition and threshold that should activate the trigger.
Actions
After defining the condition, choose what should happen when it is met. Depending on the available configuration, actions can notify you by email or in the Visamic client.
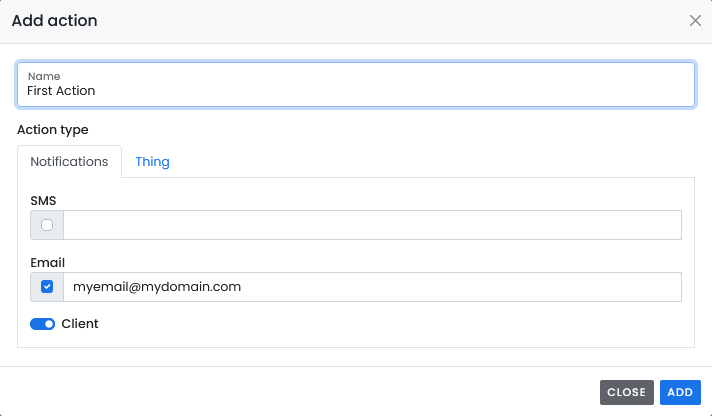
In the example, the configured email address receives a message when the condition is met. Enabling the Client action also makes the notification available in the web interface.