Build a dashboard
Once you have connected a sensor, create a Thing to define how Visamic handles its data. Then create a dashboard and add panels to visualise the values you need.
The workflow is:
- Create a Thing and connect it to a device.
- Choose whether to retain data and configure attributes, filters, or functions.
- Create a dashboard and add one or more panels.
Thing
A Thing is Visamic's core data definition. It links a device to its input and can define attributes, filters, functions, and triggers.
The Thing offers the means to:
- connect to a device;
- define a filter;
- define a function.
Select Things from the main menu and select + Create. Enter a name for the Thing:
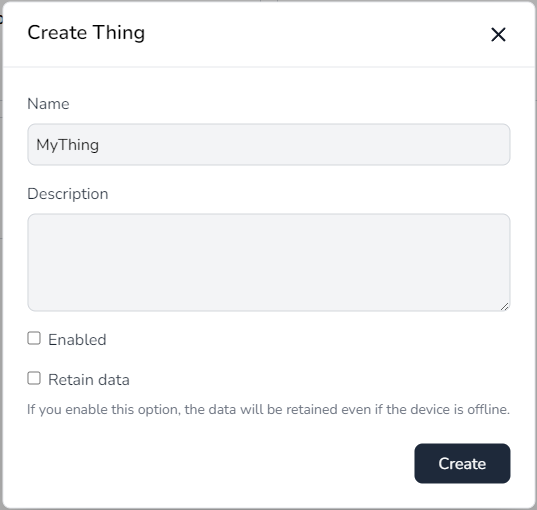
The creation form includes options such as:
- Enabled
- Retain Data
Enable Retain Data when the Thing must save incoming values. Retention is not required when you only need live monitoring or trigger evaluation. Check the limits for your Visamic plan before enabling long-term retention.
When you create the new Thing you will be presented with the following screen:
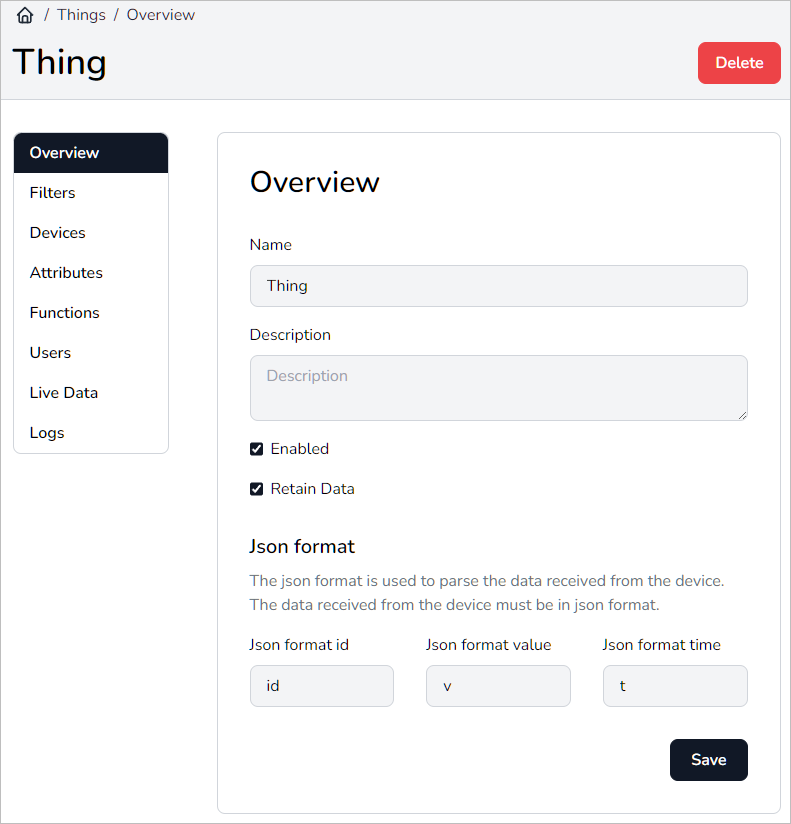
Give the Thing a name and enable Connected when it should process incoming data.
Attributes
After defining the connection, save the input and select Edit to configure it further. Select Attributes to add or edit attributes.
Attributes identify which fields from the JSON payload Visamic should extract. Once configured, they can be displayed in real time and, when retention is enabled, saved with the Thing's data.

The attribute names you add should match the names defined in the JSON payload arriving from your sensor.
Filter editor
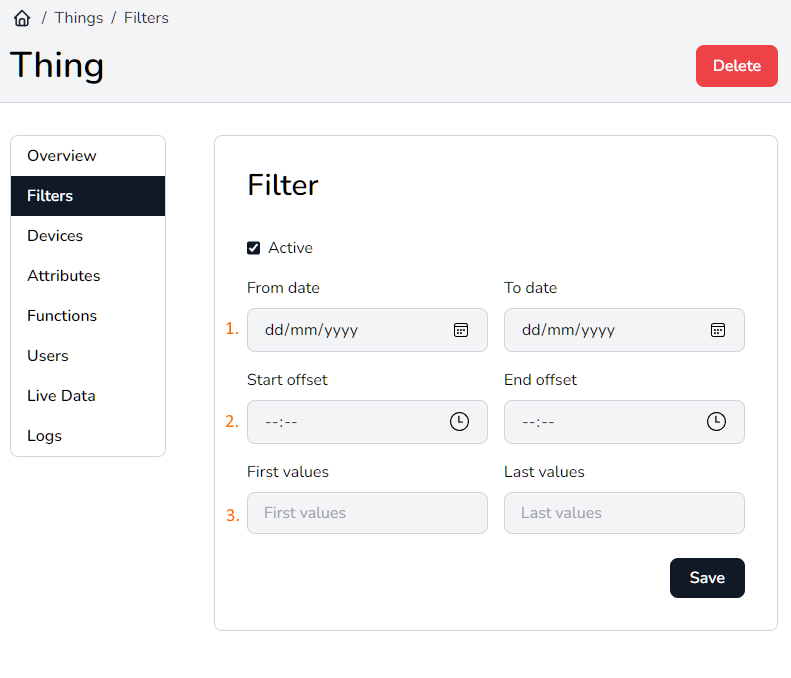
The filter editor supports these modes.
Fixed date
Set the start and end date to filter a fixed range of points from the Thing's retained data, when available. Use this format:
yyyy-MM-ddTHH:mm Example: 2021-04-16T10:46
If you leave the end date empty, the filter continues through the current data. Other Thing or datapanel settings may still limit the number of visible points.
Moving window
Set the start and end offsets to define a range relative to the timestamp of the first value in the Thing's retained data.
Use this format for each offset: HH:mm:ss.ffffff. Example: 00:00:00.000000.
Point range
Set the number of points to filter relative to the first value in the retained data.
Function editor
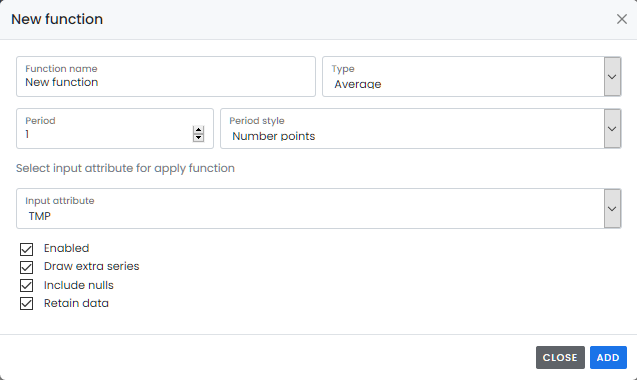
Give the function a name, select its type, and choose how many points it should process.
Datapanel
The datapanel combines a Thing's data with a visualisation and its position on a dashboard.
Create a dashboard
To create a new Datapanel you first need to create a dashboard or open an existing dashboard to which you wish to add the Datapanel.
To create a dashboard, select Dashboards in the main menu and choose New. Open the new dashboard to add a datapanel.
Add the datapanel
Select Add panel in the top-right corner of the dashboard.
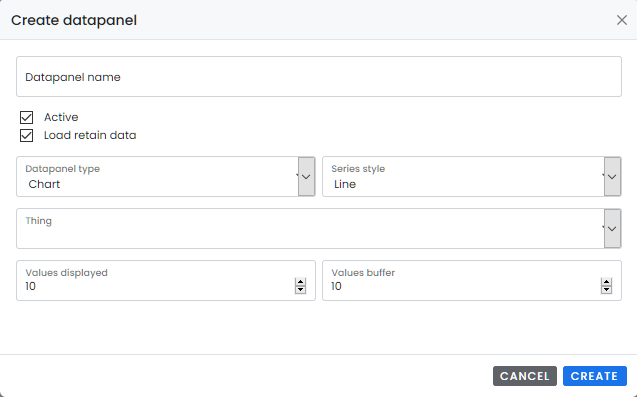
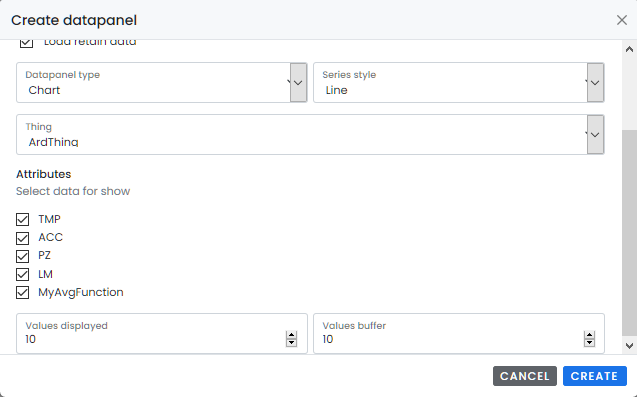
Select the Thing created earlier. Its attributes, filters, and functions are then available to the datapanel. Choose the elements you want to display.