1. Introduction
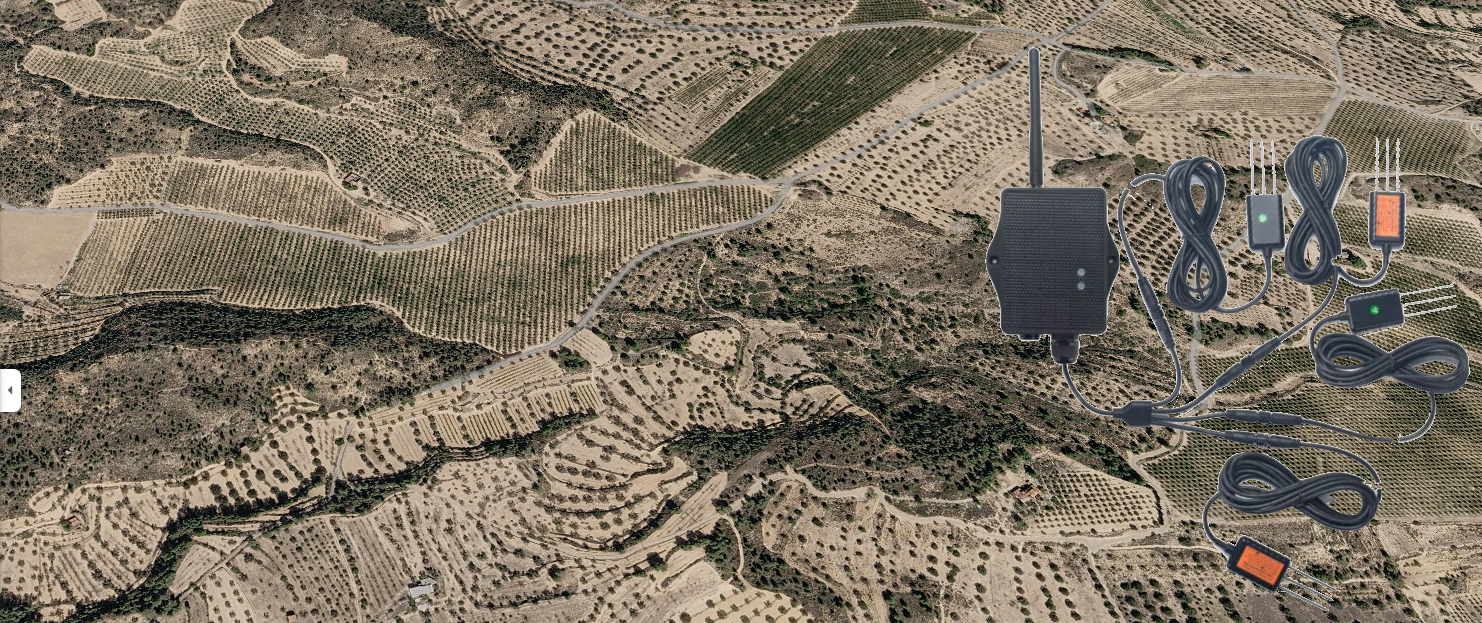
This guide describes the configuration of a Dragino SE0X-LB multi-soil-sensor LoRaWAN transmitter for Visamic.
Key features of the setup are:
LoRaWAN 1.0.3 Class A connectivity
Dragino DR-SE-6P Soil probe, providing data for volumetric water content, electrical Conductivity (EC) and soil temperature.
The setup for this connection includes 3 soil probes.
Firstly, there's a very good guide in the Dragino documentation, to many specifics relating to the setup steps described here. See:
https://wiki.dragino.com/docs/LoRaWAN-End-Node/soil-agriculture-sensors/se0x-lb/
This guide includes some of the learning steps taken on during the setup and connection of the sensors.
Pre-requisits:
to have an active LoRaWAN gateway within the transmitter distance.
to have an active account with The Things Network. See: Get started - The Things Network
2. Getting Started
I took the transmitter unit and 3 probes from their boxes and moved first, to setup the transmitter. In our case the transmitter, the SE0X | LoRaWAN Soil Moisture & EC Sensor Transmitter, is a solar-powered/assisted unit, containing a 3000mAh battery.
Activating the unit
To start the unit for transmission, it is sufficient to press the reset button for 5 seconds.
Green led will fast blink 5 times, device will enter OTA mode for 3 seconds. And then start to JOIN LoRaWAN network.
Green led will solidly turn on for 5 seconds after joined in network.
Once sensor is active, BLE module will be active and user can connect via BLE to configure device, no matter if device join or not join LoRaWAN network.
Connecting to the Things Network
Login to the Things Network following links to the Console, in our case via the Europe 1 Cluster. The Dashboard for your user space will open up.
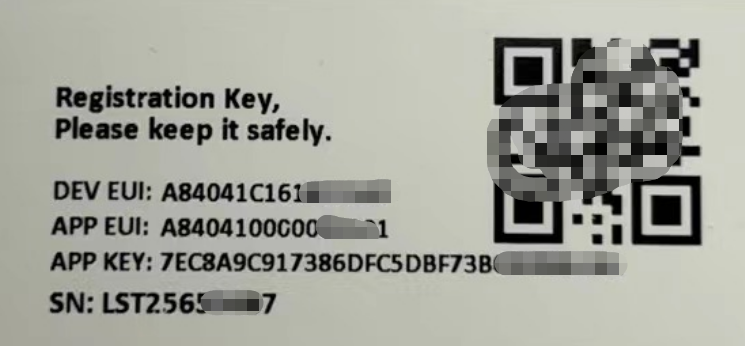
You’ll need to locate the sticker on the box that your SEOX unit was delivered in, it’ll look something like:
In the Things Network Dashboard, setup the application as directed here:
You’ll need to use the App and Dev EUIs and the APP Key. This information is unique to your sensor device and should be stored somewhere for safe keeping.
Once the application is setup on the Things Network and with the SEOX already activated, you can go to the Live Data section of the dashboard for the new application you have created, and you should see data arriving, although the interval can be 20 minutes or more between sends, so don’t expect to see data packets right away.
The data packets at this stage won’t contain any useful sensor data as the sensors are still to be connected.
Connecting the sensor probes
This part, the connection of several sensor probes (up to 4 on the SEOX), is the most complicated of the configuration steps, in this setup process, but following the instructions on the Dragino Wiki, gets you through the steps fairly effectively.
To prepare the transmitter unit to correctly forward data from each sensor probe you need to:
- Open the SEOX transmitter box to access the printed circuit board.
- download the Bluetooth configuration tool and follow the Dragino instructions for its use: https://wiki.dragino.com/docs/LoRaWAN-General-Configuration/ble-configuration/
Once you have the two prior steps in place take a look at this part of the Dragino instructions:
https://wiki.dragino.com/docs/LoRaWAN-End-Node/soil-agriculture-sensors/se0x-lb/#21-how-it-works
It describes that you need to connect each sensor probe individually and set it up before moving to the next one. All probes are shipped with their identity set as “1” and that means that if you connect 2, 3 or 4 probes to the same transmitter, all except the first (that can keep its identity “1”) need to be re-indexed accordingly in sequence.
We have 3 sensor probes to connect to our SEOX so for the first probe we do nothing, it stays as it is. To configure the second two probes (or 3 if you have four in total), you need to first connect the loose yellow wire on the inlet cable of the SEOX to the first connector location. Note, as the documentation describes, this connection should only be made whilst the configuration is being undergone and afterwards, before use, it should be disconnected and re-insulated with insulation tape before closing the box.
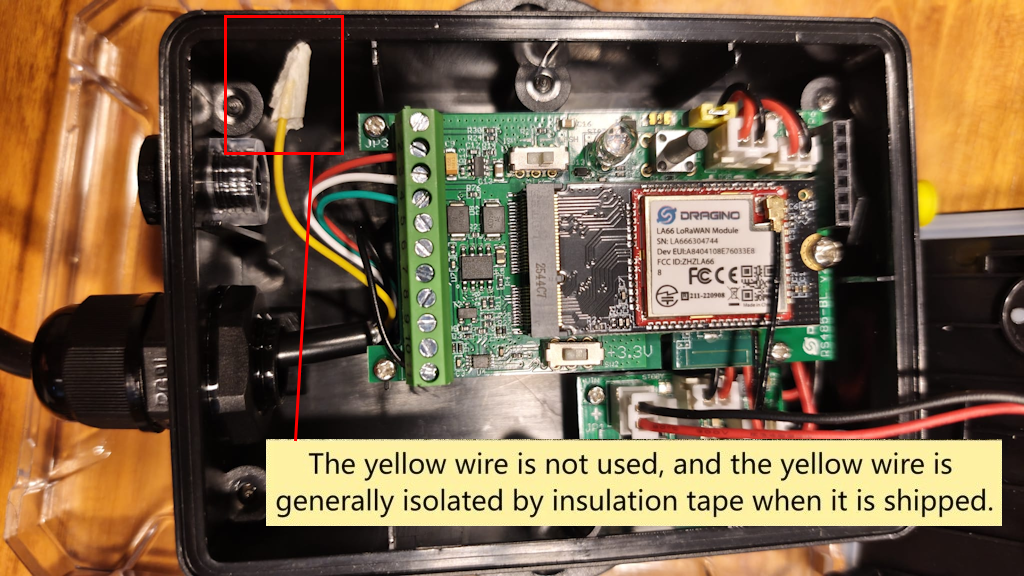
Normal connectivity scenario for active sensor use. Please be sure to insulate the yellow wire after use. When connecting/disconnecting it do not touch it to any other element of the board or connector strip other than the intended screw connector location.
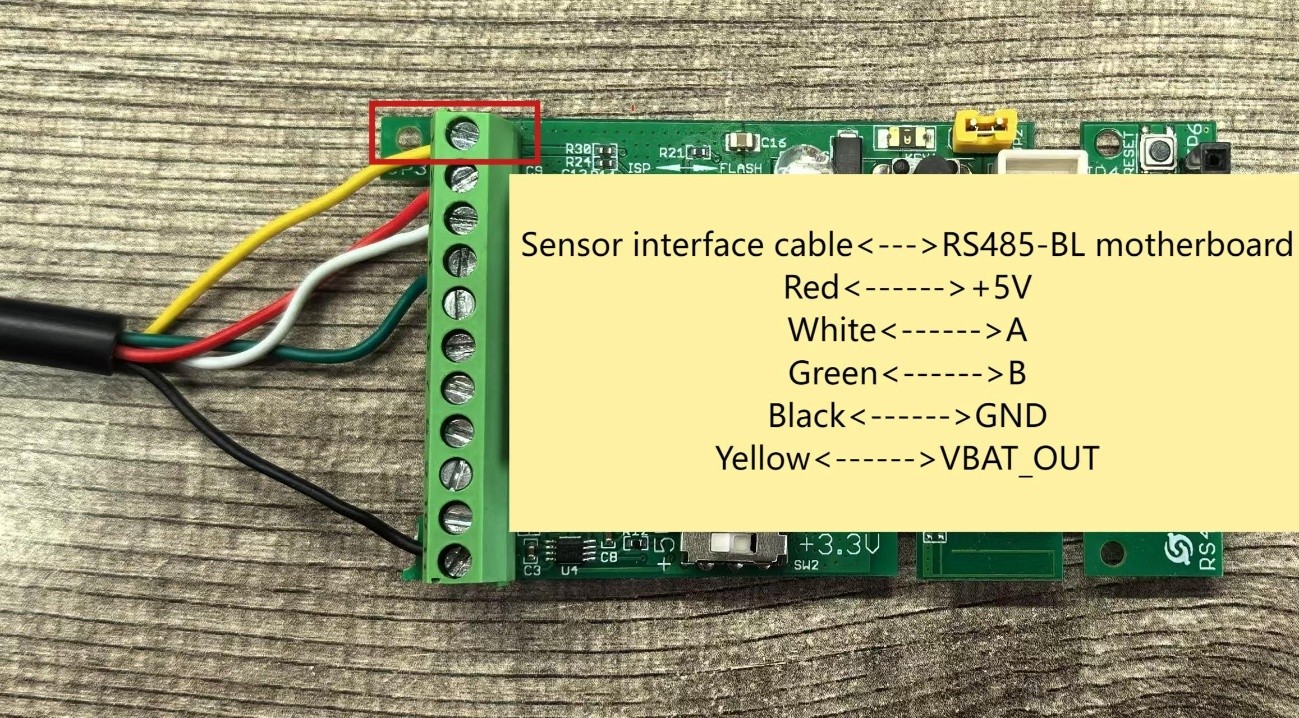
Connection of yellow wire only during re-configuration of the probes’ ids.
Whilst the yellow wire is connected, open up the Bluetooth application on your mobile device and follow the instructions to configure each probe id. In our case we connected the second probe and entered the following AT command at the correct moment in the script. Note you will be required to enter the password (AT Pin) that you can find on the device label, before entering AT commands to configure the probe id. Each probe is connected uniquely, ie. no other probes connected, whilst it is being configured.
The Dragino SEOX wiki document, in section 3.3.5, https://wiki.dragino.com/docs/LoRaWAN-End-Node/soil-agriculture-sensors/se0x-lb/#335-setting-the-sensor-address, describes these AT commands:
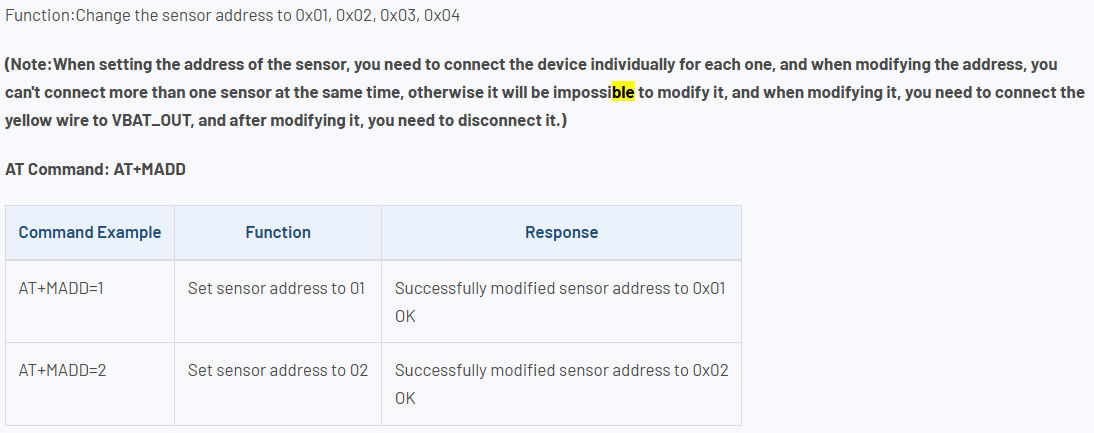
The first instruction won’t be necessary (as probe 1 already has id 1).
You’ll be using the following instructions for your remaining probes 2, 3 and 4:
AT+MADD=2 AT+MADD=3 AT+MADD=4
| Confirmation in the BLE app will look like this:
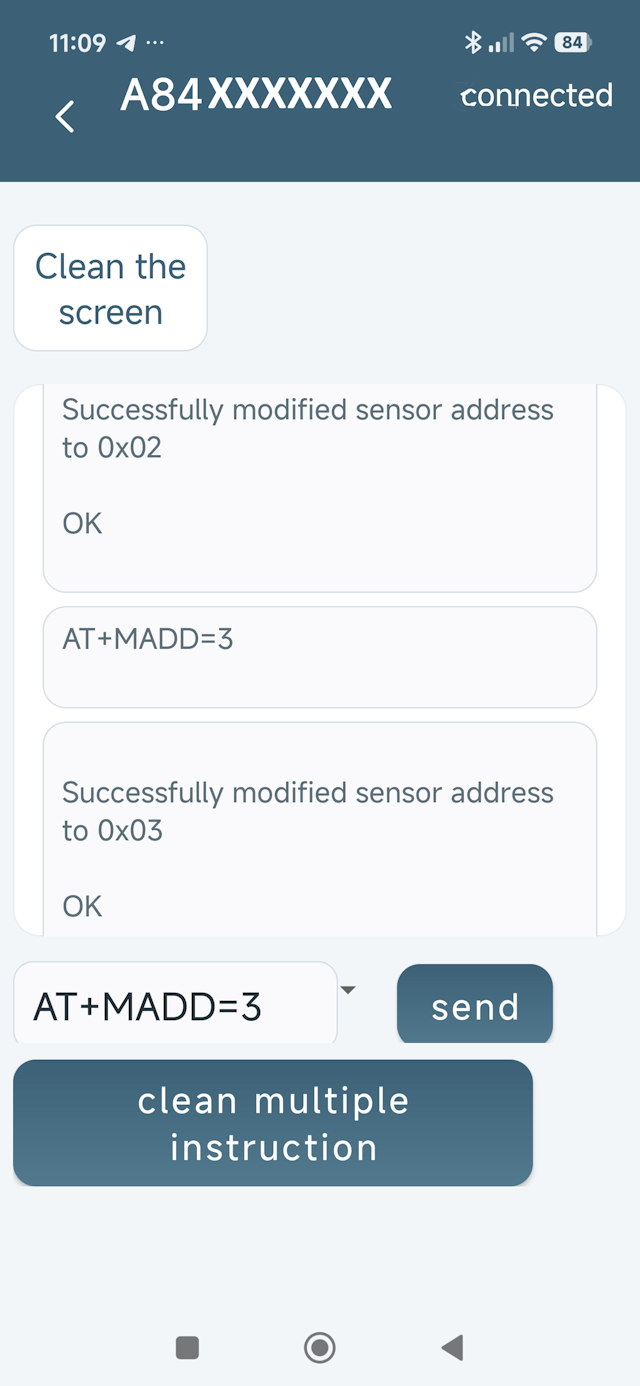
|
Once each probe has been configured, disconnect the yellow wire as previously described, insulate the end and close up the SEOX box to be watertight once again. Connect all the probes to a cable on the SEOX. I deduced that the order isn’t important but it is better in my view, that you label and control the order of the probes at all times because you’ll be connecting them in different locations or at different soil depths, so it is better that you easily control which is which.
Receiving data
After adding the probes to the SEOX transmitter, reset the unit by pressing the reset button.
Data should start to arrive at the Live data console in the Things Network application dashboard.
If you followed all of the steps earlier, when adding and configuring the SEOX transmitter for the The Things Application, then you may already have the data packets in a human-readable format, otherwise, return to the dashboard to configure the custom payload parser as described here:
Please note that the custom payload parser can be downloaded from here:
https://github.com/dragino/dragino-end-node-decoder/tree/main/SE0X-LB
The SE0X-LB decoder.txt file contents should be used to replace the default parser script here under the “Default uplink payload formatter“ section.
Data should start arriving that includes this payload format:
    "uplink_message": {
      "session_key_id": "xxxFFFFxxxx",
      "f_port": 2,
      "f_cnt": 581,
      "frm_payload": "D/YMzA4G/gsYAEAG8wvUADoF2As9AEQ=",
      "decoded_payload": {
        "BatV": 4.086,
        "Mod": 0,
        "Node_type": "SE0X-LB",
        "conduct_SOIL1": 64,
        "conduct_SOIL2": 58,
        "conduct_SOIL3": 68,
        "i_flag": 0,
        "s_flag": "1110",
        "temp_DS18B20": "327.60",
        "temp_SOIL1": "28.40",
        "temp_SOIL2": "30.28",
        "temp_SOIL3": "28.77",
        "water_SOIL1": "17.90",
        "water_SOIL2": "17.79",
        "water_SOIL3": "14.96"
      },
3. Viewing the sensor data
All The Things Network applications emit an MQTT protocol publication of the data served via the LoRaWAN device. Visamic hooks into that data.
The Things Network MQTT Settings
In the application you have created in the Things Network dashboard, you can find the details under the ‘Other Integrations’ section:
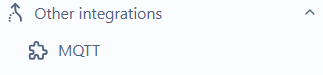
Clicking on the MQTT link takes you to the settings page where you will see the servernames of the service provided. In the Euro zone those servers are:

The exact servers will vary according to the geographical zone in which you are located.
The next settings include the username and password used as credentials to connect to the service. The username is typically the name of the application but you can choose to modify that here:

The first time you enter (and you can, optionally, re-change it at any later moment) you can click the “Generate new API key” to generate the password that you will use at connection time. You should make a note of all the details on this page as you will use them for connection from Visamic.
You’re now ready to go to setup the device and data visualisations in Visamic.
4. Configuring Visamic
To setup a visualisation of the data from your newly setup sensor device in Visamic, we’ll be adding the settings to a Visamic Datasource, then we’ll setup a Thing to extract specific parts of that data and then we’ll configure the visualisation Dashboard of the data.
Sign-in or free sign-up
Connect to Visamic, you’ll need to have an account setup. If you don’t already have an account, click the “Get Started Free” button and follow the instructions on the homepage here to signup: https://web.visamic.com/
Setting up Device connection to The Things Network
Select the Data sources tab from the menu on the left of the web page.
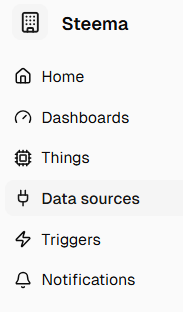
Click on the + Create Data Source button
Select the LoRaWAN option
Configure the Basic Information
Using the information generated in the The Things Network dashboard you can make the connection.
In the case of our Soil sensors we used the following information:
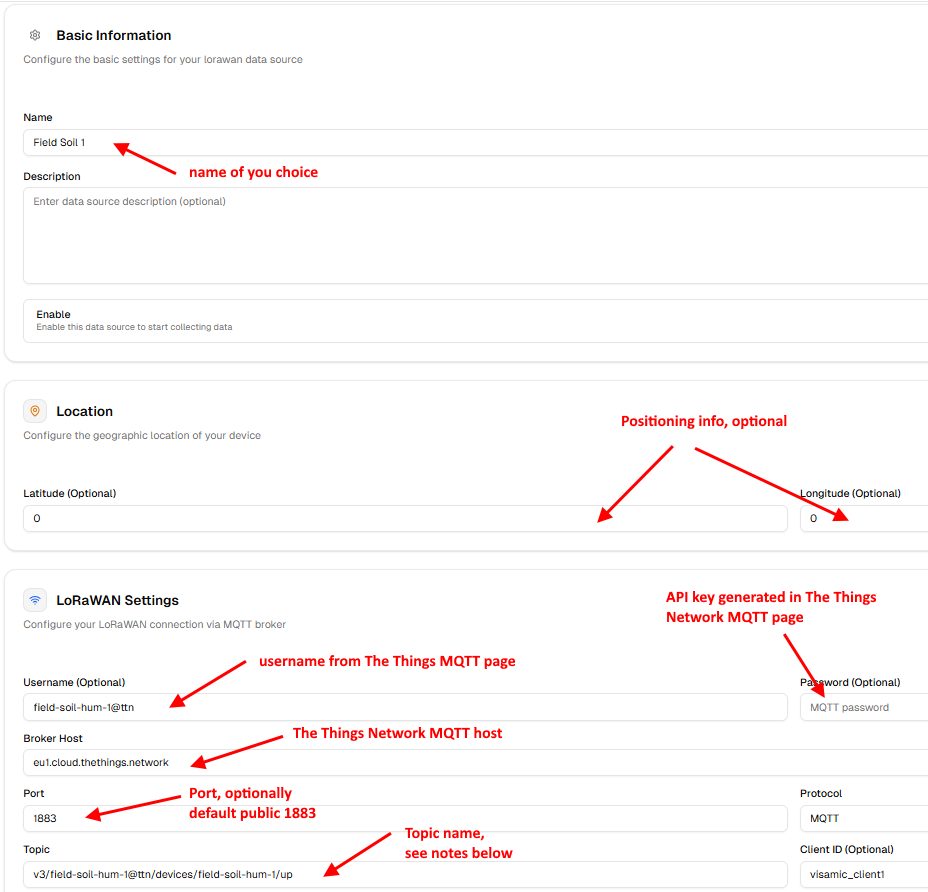
Topic name
The topic name, example in this case:
v3/field-soil-hum-1@ttn/devices/field-soil-hum-1/up
is a composite that follows the standard MQTT topic names structure.
ie.
v3/{application-id}@ttn/devices/{device-id}/{message-type}
- application-id = the application id you have define, here: field-soil-hum-1
- device-id = device name you have configured, in this case it’s the same as the application id but it could be different: field-soil-hum-1
- message-type = up for upload, down for download. In this case we’re looking for the ‘up’ value: up
Positioning info.
You can optionally set position information for the sensor. That may be particularly useful if you decide to add the sensor to a Visamic map panel. Note the following information on format and precision:
Decimal degrees express geographic coordinates as fractions of a degree. Latitude ranges from -90° to +90° (South to North), and longitude ranges from -180° to +180° (West to East). Precision depends on decimal places: 1 place is ~11.1 km, while 5 places offer ~1.1 m accuracy. [1, 2, 3, 4]
Value Ranges and Signs
Latitude range: -90.0000° to +90.0000°
Longitude range: -180.0000° to +180.0000°
Decimal Places and Precision Levels
1 decimal place: ~11.1 km of precision (city block level)
2 decimal places: ~1.11 km of precision (neighborhood level)
3 decimal places: ~111 m of precision (large building or park)
4 decimal places: ~11.1 m of precision (precise street address/house)
5 decimal places: ~1.11 m of precision (individual tree or person)
6 decimal places: ~0.11 m / 11 cm of precision (high-grade GPS mapping) [1, 2]
Adding a Thing to manage the datasource data
The Datasource brings the data from the sensors into the Visamic platform, a Thing will be used to extract the parts of the data that are of interest to us, to name and packet them for easy use in the visualisation Dashboard.
Create the Thing
Select the Things option from the left-hand side menu:
Use the Create Thing button to start the configuration:
You will be prompted to name the Thing as you create it.
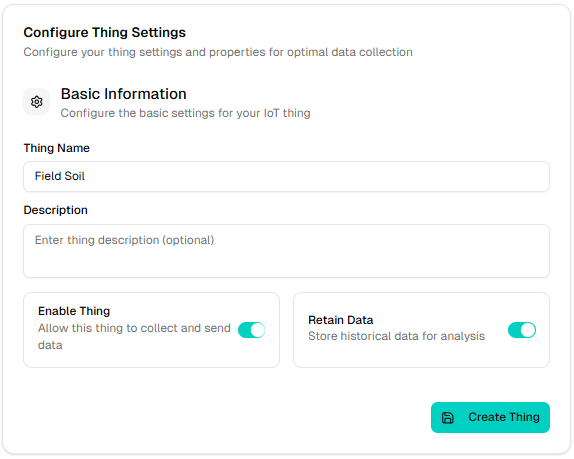
We’ve given the new Thing a name, ‘Field Soil’. Note the option for ‘Retain Data’, when active this will store data as it arrives, allowing it to be loaded for view and analysis at any time, not just as it arrives.
Configure the Thing
Note the configuration options:
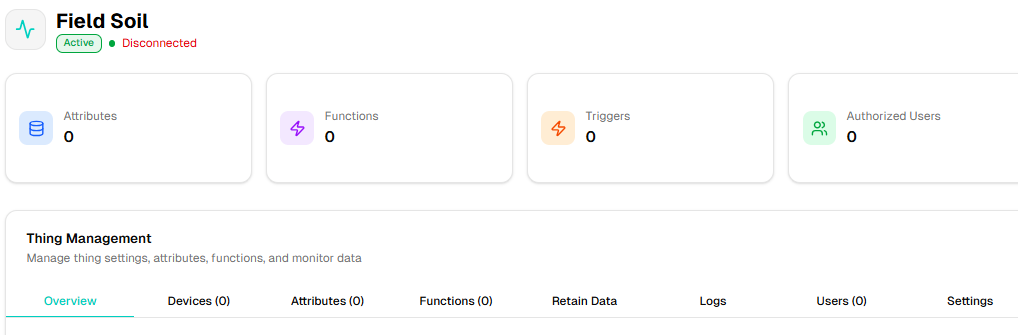
We’ll need to:
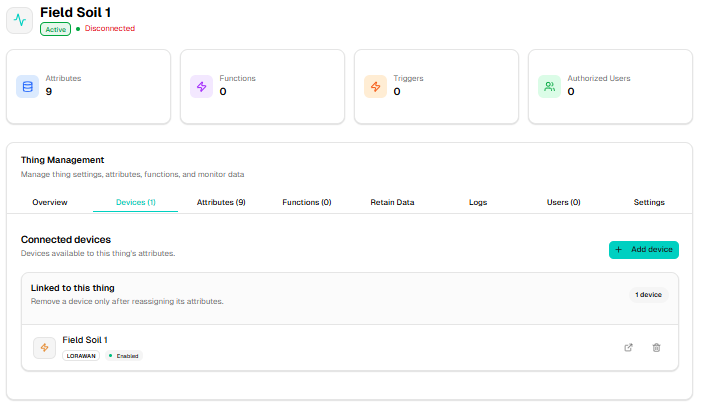
1. Select a Device. Select the Devices tab and use the button:
Choose the device you created in the last step, ‘Field Soil 1’.
2. Select the Attributes tab and add Attribute. That displays the following dialogue, here already filled out:
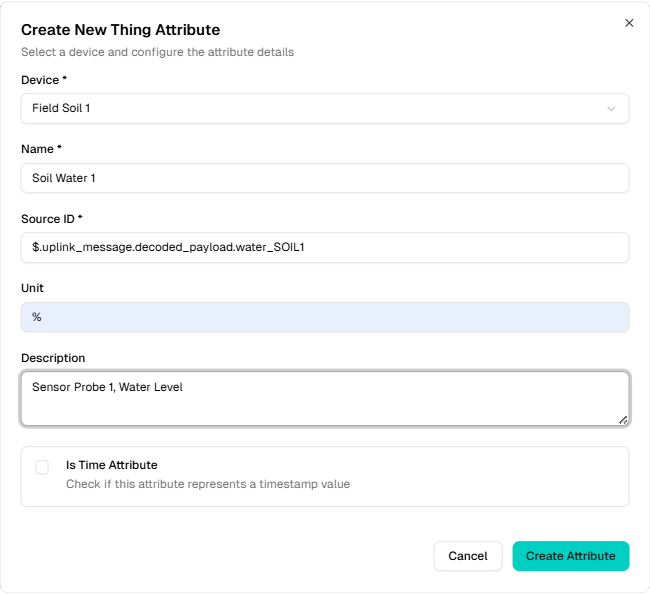
The source id is the most complex entry on this form. It has been defined in the following way. Taking the original packet json we saw earlier:
    "uplink_message": {
      "session_key_id": "xxxFFFFxxxx",
      "f_port": 2,
      "f_cnt": 581,
      "frm_payload": "D/YMzA4G/gsYAEAG8wvUADoF2As9AEQ=",
      "decoded_payload": {
        "BatV": 4.086,
        "Mod": 0,
        "Node_type": "SE0X-LB",
        "conduct_SOIL1": 64,
        "conduct_SOIL2": 58,
        "conduct_SOIL3": 68,
        "i_flag": 0,
        "s_flag": "1110",
        "temp_DS18B20": "327.60",
        "temp_SOIL1": "28.40",
        "temp_SOIL2": "30.28",
        "temp_SOIL3": "28.77",
        "water_SOIL1": "17.90",
        "water_SOIL2": "17.79",
        "water_SOIL3": "14.96"
      },
..we have, from json descendency, $.uplink_message wrapping decoded_payload.water_SOIL1
Giving us the required Source ID: $.uplink_message.decoded_payload.water_SOIL1
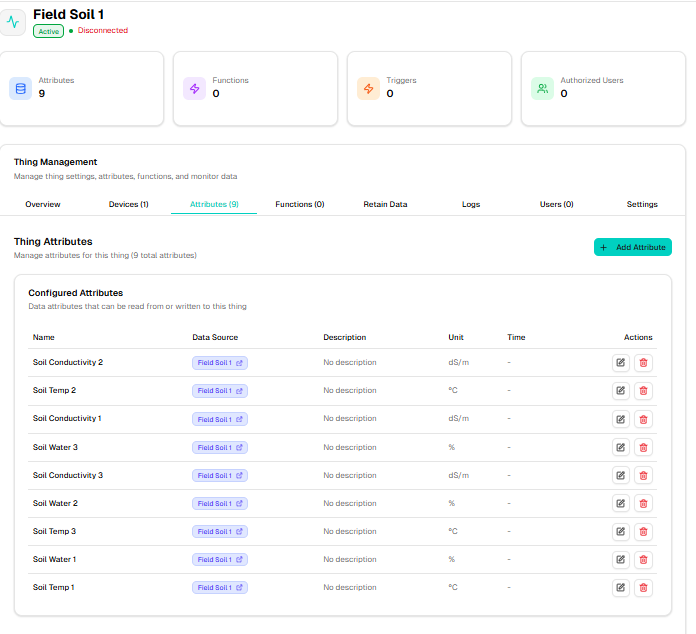
The pattern can be repeated for all other 8 values for WATER, SOIL and conduct.
Eg.
$.uplink_message.decoded_payload.water_SOIL2
$.uplink_message.decoded_payload.water_SOIL3
$.uplink_message.decoded_payload.conduct_SOIL1
$.uplink_message.decoded_payload.conduct_SOIL2
//etc
Once added, for our field soil sensor that gives us the following definition for the Thing:
Creating the Data Visualisation Dashboard
Once you have defined the datasource Device and a Thing (or Things) that uses it, you are ready to configure different ways of viewing the data in a Dashboard
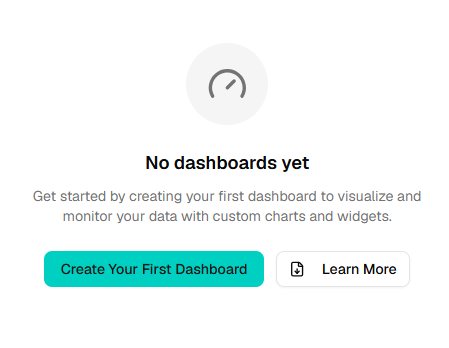
Open the Dashboard option from the left-hand side menu
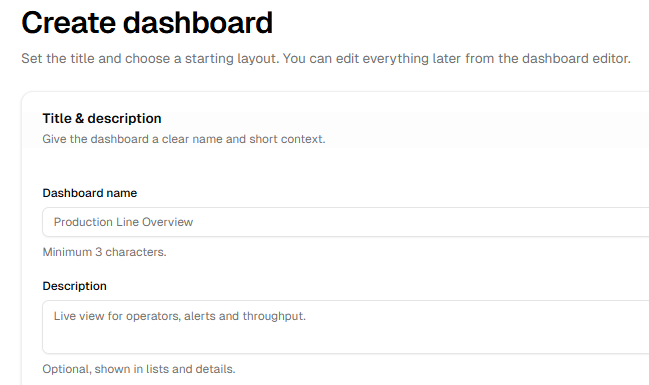
Select Create Dashboard:
Name the Dashboard and click “Create Dashboard” to enter view and editor.
Adding a Visualisation Panel
The first time you open the dashboard you will have no panels created and will see this view:
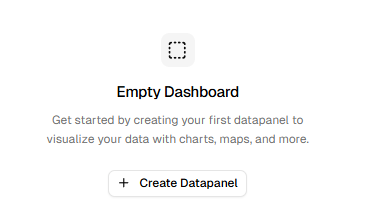
Press the “Create Panel” button.
Currently you can choose from the following visualisation types:
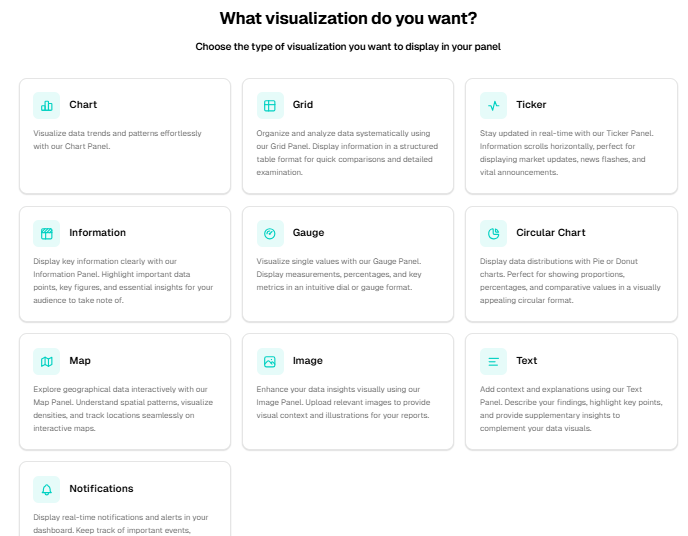
We’ll choose two visualisation types for this tutorial, though virtually any type will do, and in later articles we’ll deal with some specialised views, ideally suited to sensor location for agricultural applications.
Adding a Chart Panel
Click to add the panel and you will see this dialogue:
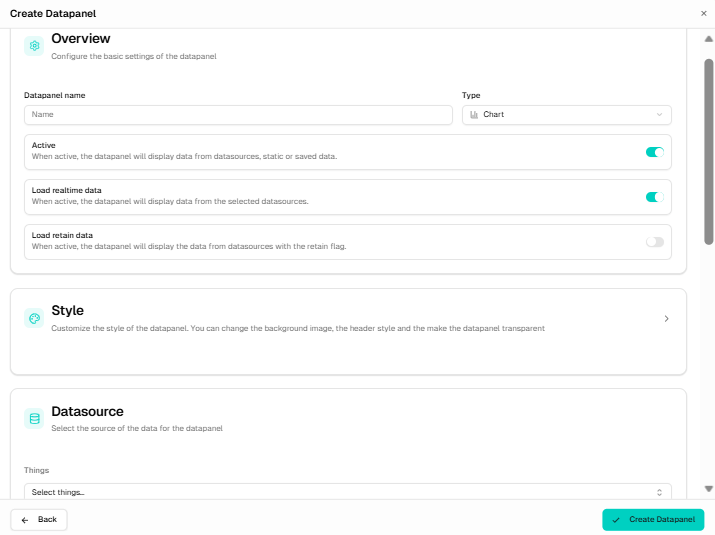
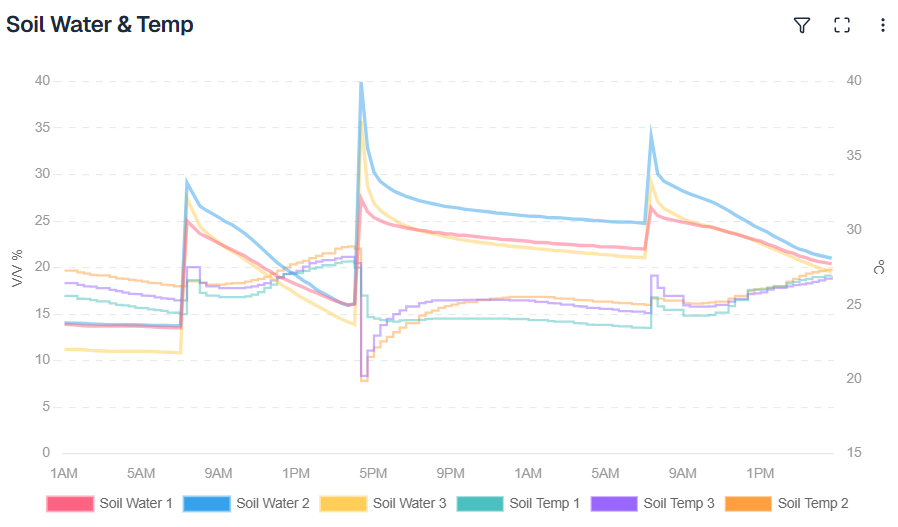
Add a name, we named our Panel “Soil Water & Temp”. We recommend activating the “Load retain data” option so that stored data loads with the chart when opening the dashboard.
Datasource
Select the Thing you created, ours named “Field Soil 1”.
When you check the checkbox for “Field Soil 1” in the Thing section, Visamic will show all of the Attributes available for plotting the Chart. Select the attribute that you are interested in seeing. For the case of our Chart we have selected all the available attributes and have associated the temperature readings to the right axis and the water level readings to the left axis.
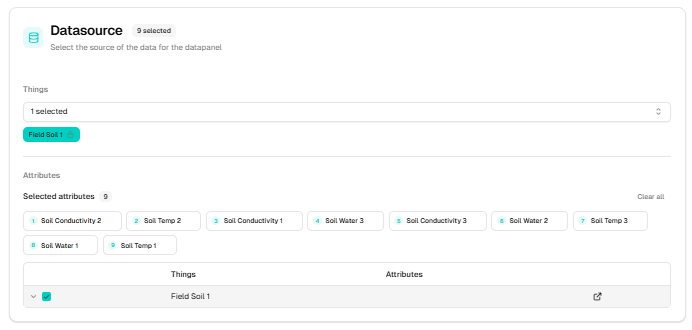
Selected attributes
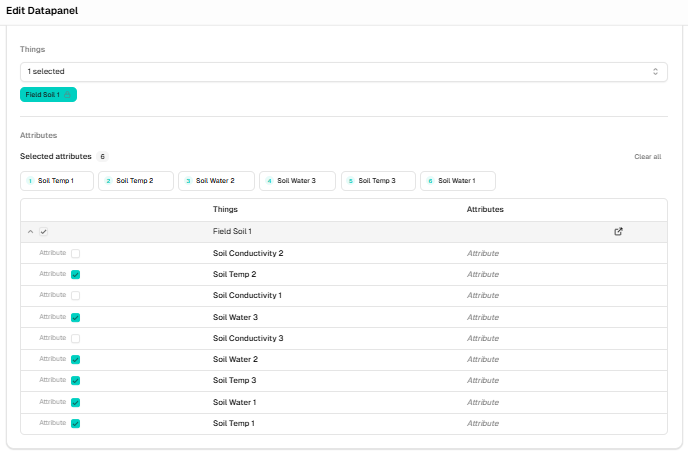
Chart Configuration
We’re using the fields of the Chart Configuration dialogue to add an extra axis to the right and associate the data series with that axis, and to add titles for the axes and series.
Axis Editor
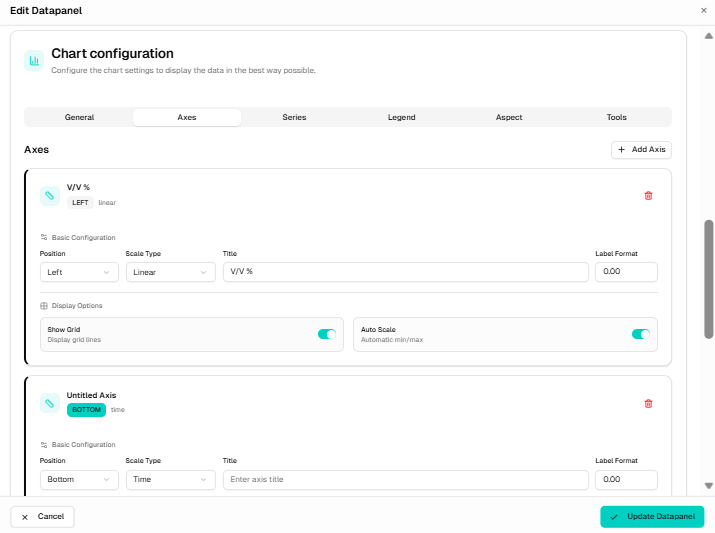
Series Editor
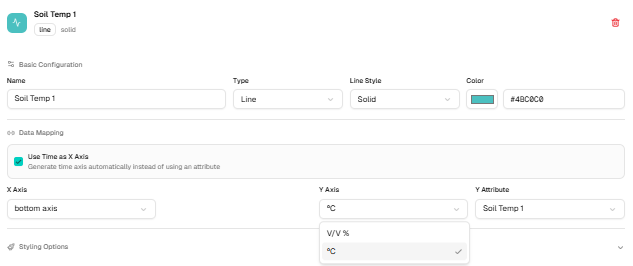
Save/update the Datapanel:
That then returns to view mode. Depending on how much data has already accumulated in retain data the displayed chart may be fairly full or not yet. An example of the output is shown below:
Adding a Grid Panel
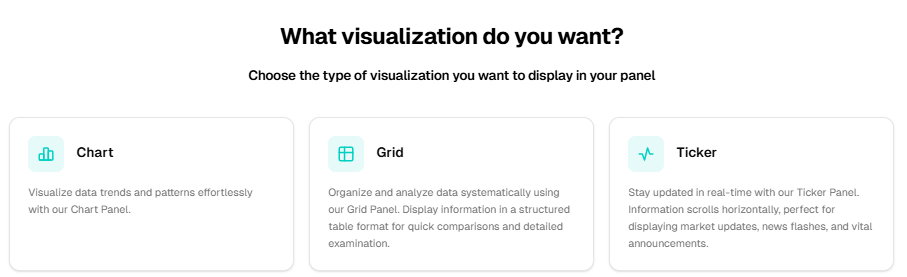
The steps to add a Grid panel are fairly similar to those of the Chart. Select Grid when adding a new Datapanel using the + button at the top, right of the dashboard:
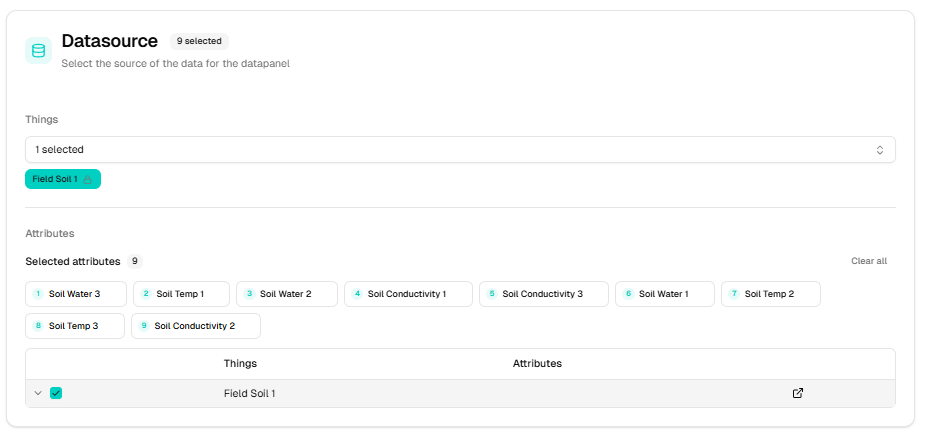
The Thing and Attribute selections steps are identical to those of the Chart, see section Adding a Chart Panel.
Once the fields have been selected to include in the Grid, save using the Update Datapanel button:
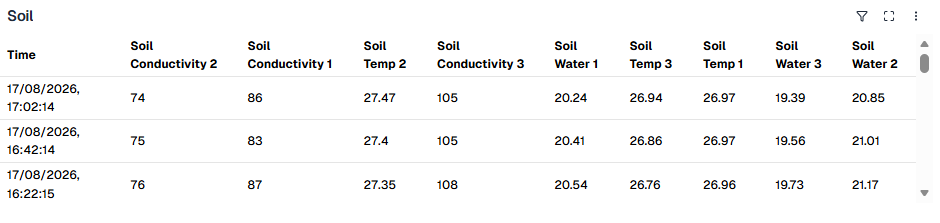
That will return you to the grid data view. Eg:
Summary
There are many more options and steps available in the configuration of the dashboard, including the adding of functions and alarm thresholds. Those are covered in other sections of the Visamic documentation.